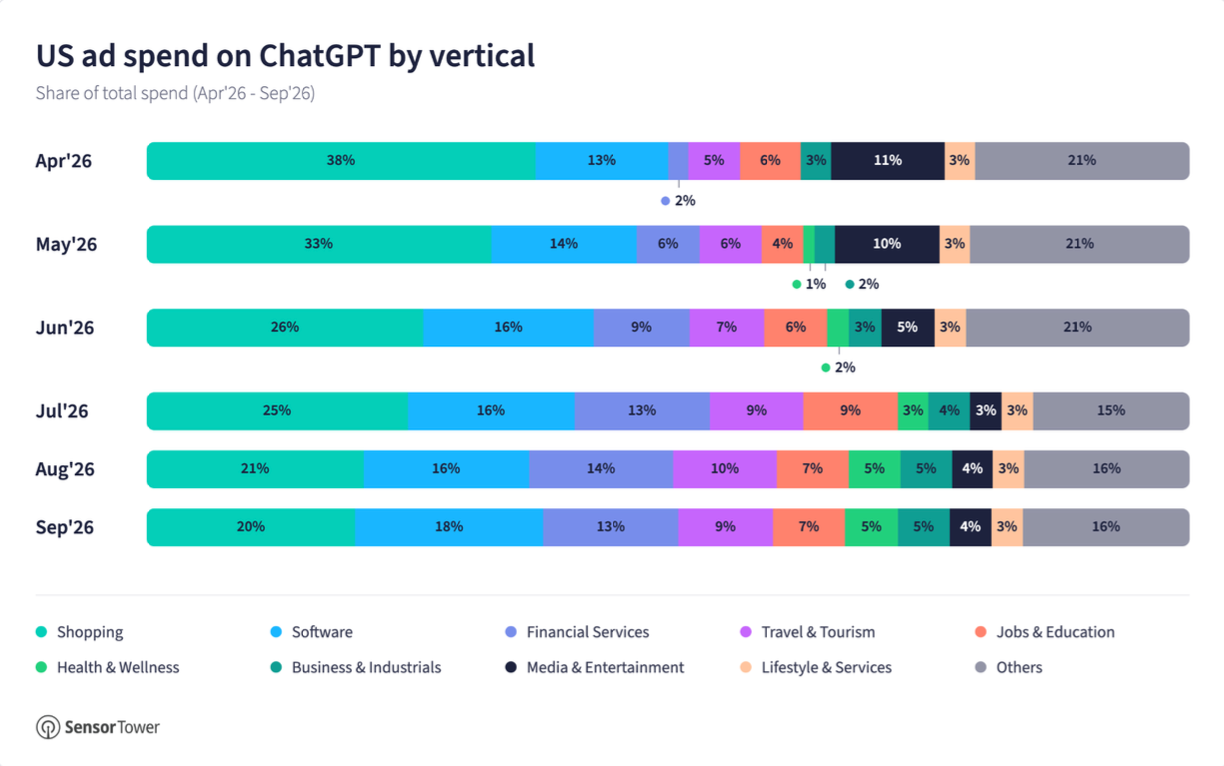
Sensor Tower data cited by Digiday on November 5, 2026 shows how U.S. advertisers have redistributed spending on ChatGPT ads since the placements began. The chart tracks each vertical's share of total U.S. ad spend on ChatGPT from April through September 2026.
Shopping led in every month but its share fell from 38% in April to 20% in September. Software rose from 13% to 18% over the same period. Financial services grew from 2% to 13%, with a peak of 14% in August. Travel and tourism moved from 5% to 9%, and jobs and education from 6% to 7%. Health and wellness reached 5% by August and held it in September, and business and industrials also stood at 5% in September. The Others group held 16% in September.
Advertiser counts rose in step. Adthena data in the same Digiday report put distinct brands advertising on ChatGPT at 1,082 in June, 3,741 in July, and 6,333 in August, with a projected 6,830 for September based on data through September 20. Those counts span the U.S., Australia, the U.K., and the EU.
Results data is thinner. A working paper by Maximilian Kaiser and Christian Schulze, covering U.S. ecommerce advertisers, reported revenue per session of $0.89 for paid ChatGPT visits against $2.45 for paid Google Search. The same paper put conversion at 0.37% for ChatGPT and 1.17% for Google.
Source: Digiday - https://digiday.com/marketing/in-graphic-detail-chatgpt-s-ad-growth-is-outrunning-the-proof-that-it-works/