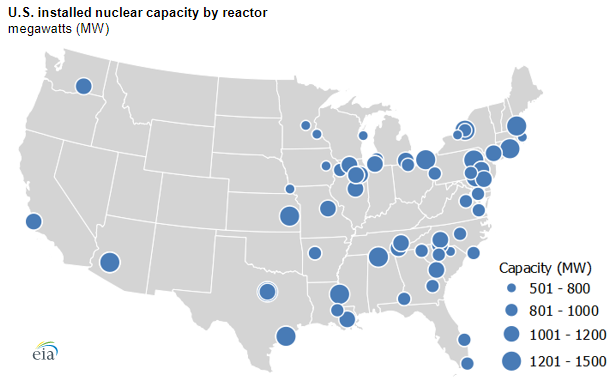
A U.S. Energy Information Administration map plots installed nuclear capacity for every operating U.S. reactor, with circles sized in four bands from 501 to 1,500 megawatts. The map accompanies EIA's March 2020 analysis of 2019 generation data, which found that nuclear plants provided about 20 percent of total annual U.S. generation.
Of the 30 states with operating commercial nuclear plants, 12 generated more than 30 percent of their in-state electricity from nuclear power in 2019. New Hampshire had the largest share at 61 percent, followed by South Carolina at 56 percent. Illinois generated 54 percent of its electricity from nuclear and has the most reactors (11) and the most nuclear generating capacity (11.6 gigawatts) of any state.
The Grand Gulf Nuclear Station in Port Gibson, Mississippi, houses the largest single reactor in the United States, with a capacity above 1,400 megawatts. The largest nuclear power plant is Palo Verde in western Arizona. Its three reactors made it the largest U.S. power plant by annual generation, at nearly 32 million megawatthours in 2019.
The NRC licenses reactors to operate for 40 years and allows renewals of up to 20 years at a time. All but two U.S. reactors had received renewals at the time of the analysis. Clinton in Illinois and Watts Bar Unit 2 in Tennessee were still on their initial licenses. In late 2019 the NRC approved the first subsequent renewal extending reactors at Turkey Point from 60 to 80 years, and it approved the same for Peach Bottom Units 2 and 3 in March 2020.
At the time, two reactors were under construction at Plant Vogtle in Georgia, each planned at about 1,100 megawatts. Georgia Power reports both units have since entered commercial operation.
Source: U.S. Energy Information Administration - https://www.eia.gov/todayinenergy/detail.php?id=43256