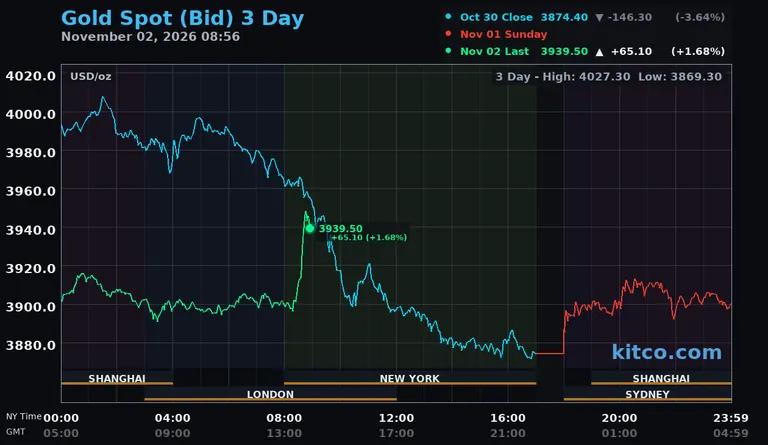
Kitco's three-day spot gold chart, priced in U.S. dollars per ounce and stamped November 2, 2026 at 8:56 a.m. New York time, tracks gold after its worst monthly performance since 2008. The October 30 close was $3,874.40, down $146.30 or 3.64%. The November 2 reading was $3,939.50, up $65.10 or 1.68%. The three-day high was $4,027.30 and the low was $3,869.30.
The October 30 line opens near $3,990, climbs to roughly $4,008 in early Asian trading, then declines through the London and New York sessions to a low near $3,870 before the close. The November 2 line opens near $3,900, holds between about $3,890 and $3,915 through Asia and London, and spikes to about $3,950 as New York trading begins. The Sunday evening Sydney session trades near $3,900.
Kitco's early Monday report put spot gold near $3,945.70, up $67.90 or 1.80%, and spot silver near $50.94, up $1.81 or 3.66%. Kitco attributed the recovery to bargain hunting, lower Treasury yields and a softer dollar. Brent crude fell toward $108.55 a barrel, WTI traded near $99.58, the 10-year Treasury yield stood near 4.93% and the dollar index was near 101.50. The Federal Reserve held its target range at 3.75% to 4.00% last week, and futures markets place the chance of a December increase near 75%.
Kitco listed technical levels for gold. Resistance sits at $3,978 and then $4,035, with a sustained move targeting $4,086. Support sits at $3,817 and then $3,719.
Source: Kitco News - https://www.kitco.com/news/article/2026-11-02/gold-silver-rebound-iran-diplomacy-sends-oil-lower-easing-fed-tightening