The gold-silver price ratio has a long-run equilibrium of 59.65 ounces of silver per ounce of gold, according to a statistical study published by the Washington-based Silver Institute and prepared by consultancy Precious Metals Insights. The finding comes from a cointegration test on monthly data from January 1970 through May 2026, which the authors say shows the ratio tends to return toward that level over time rather than moving at random.
The report found that the link between the two metals has grown tighter in recent decades. Using daily price returns from January 2006 to May 2026, gold and silver showed a correlation coefficient of 0.795. Over the 2018 to 2025 period, the ratio averaged just under 83 to 1, well above the long-run anchor.
The U.S. dollar has done little to explain swings in the ratio. While both metals individually move against the dollar index, the study found only a weak 0.12 correlation between the dollar and the ratio for 2006 through May 2026, and no systematic link across the full 1970 to 2026 period. The authors note that 2006 was the year the first silver exchange-traded fund launched, and they connect the modest new relationship to greater financial trading in both metals.
The report identified investment demand as the main driver of shifts in the ratio. Since 2000, the ratio has tracked gold investment more closely, while the 1980 to 2000 period was dominated by silver investors moving from buying to heavy selling.
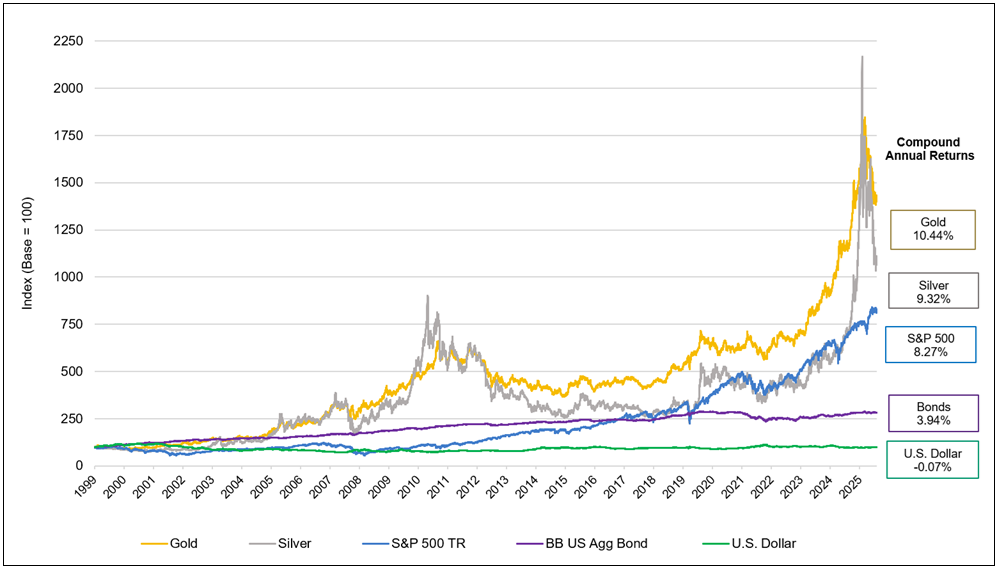
A Sprott chart shows that from the end of 1999 through July 2026, gold returned 10.44 percent a year and silver 9.32 percent, compared with 8.27 percent for the S&P 500 total return index.
Source: The Silver Institute -- https://silverinstitute.org/goldsilver-ratio-continues-to-be-relevant-in-the-modern-era/