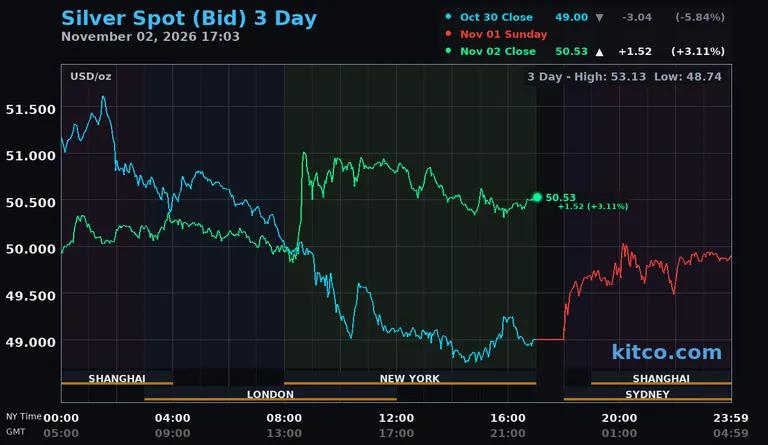
Kitco's three-day spot silver chart, priced in U.S. dollars per ounce and stamped November 2, 2026 at 5:03 p.m. New York time, shows the October rout and the first day of recovery. The October 30 close was $49.00, down $3.04 or 5.84% on the day. The November 2 close was $50.53, up $1.52 or 3.11%. The three-day high was $53.13 and the low was $48.74.
The chart plots each session as its own line across the Shanghai, London, New York and Sydney trading windows. The October 30 line starts near $51.00, peaks above $51.50 in the early Asian hours, then slides through London and New York to a low near $48.75 before closing at $49.00. The November 2 line opens near $50.00, jumps to about $51.00 in early New York trading and holds between roughly $50.30 and $51.00 into the close. The Sunday evening Sydney session trades near $49.90.
Kitco's Monday report put spot silver near $50.80, up $1.80 or 3.67%, while spot gold stood near $3,945.80. Kitco linked the rebound to a drop in crude oil prices of more than 7%, with Brent settling at $104.77 and WTI at $96.46. The 10-year Treasury yield traded near 4.9%, and futures markets placed the chance of a Federal Reserve rate increase in December near 75%.
Kitco listed technical levels for silver. Resistance sits at $54.72 and then $59.00, and support sits at $49.04 and then $45.66. A break below $49.04 would open the way toward $45.66, while a push above the $54.72 to $59.00 zone would target $61.00 and then $62.03.
Source: Kitco News - https://www.kitco.com/news/article/2026-11-02/gold-silver-recover-october-rout-oil-drops-fed-tightening-bets-persist