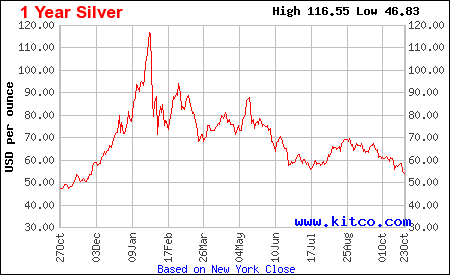
Kitco's one-year silver chart, based on New York close and priced in U.S. dollars per ounce, reports a high of $116.55 and a low of $46.83 for the period ending in late October 2026. The chart spans roughly October 2025 to October 2026 on a scale of $30 to $120.
The low sits at the left edge of the chart in late October 2025, with silver near $47 to $50. The line climbs through the winter, passes $100 in early 2026 and peaks at $116.55 around late January. A steep drop follows, with a rebound to the mid $90s in February and a second high near $88 in early May.
From May the line trends lower. Silver dips below $60 in June and holds in a band of roughly $56 to $63 through July, then recovers to about $69 in late August. September and October show another decline. Kitco's PM Report put spot silver near $53.90 on Friday, October 23, down 1.26% that day.
At that level silver sat about 54% below the chart's peak and roughly 15% above its one-year low. Kitco attributed the recent weakness to higher crude oil prices and expectations for restrictive Federal Reserve policy, with concern about manufacturing demand weighing on silver more than on gold. The Federal Open Market Committee meets October 27 and 28, and September personal consumption expenditures inflation data are due October 29.
Source: Kitco - https://www.kitco.com/charts/silver