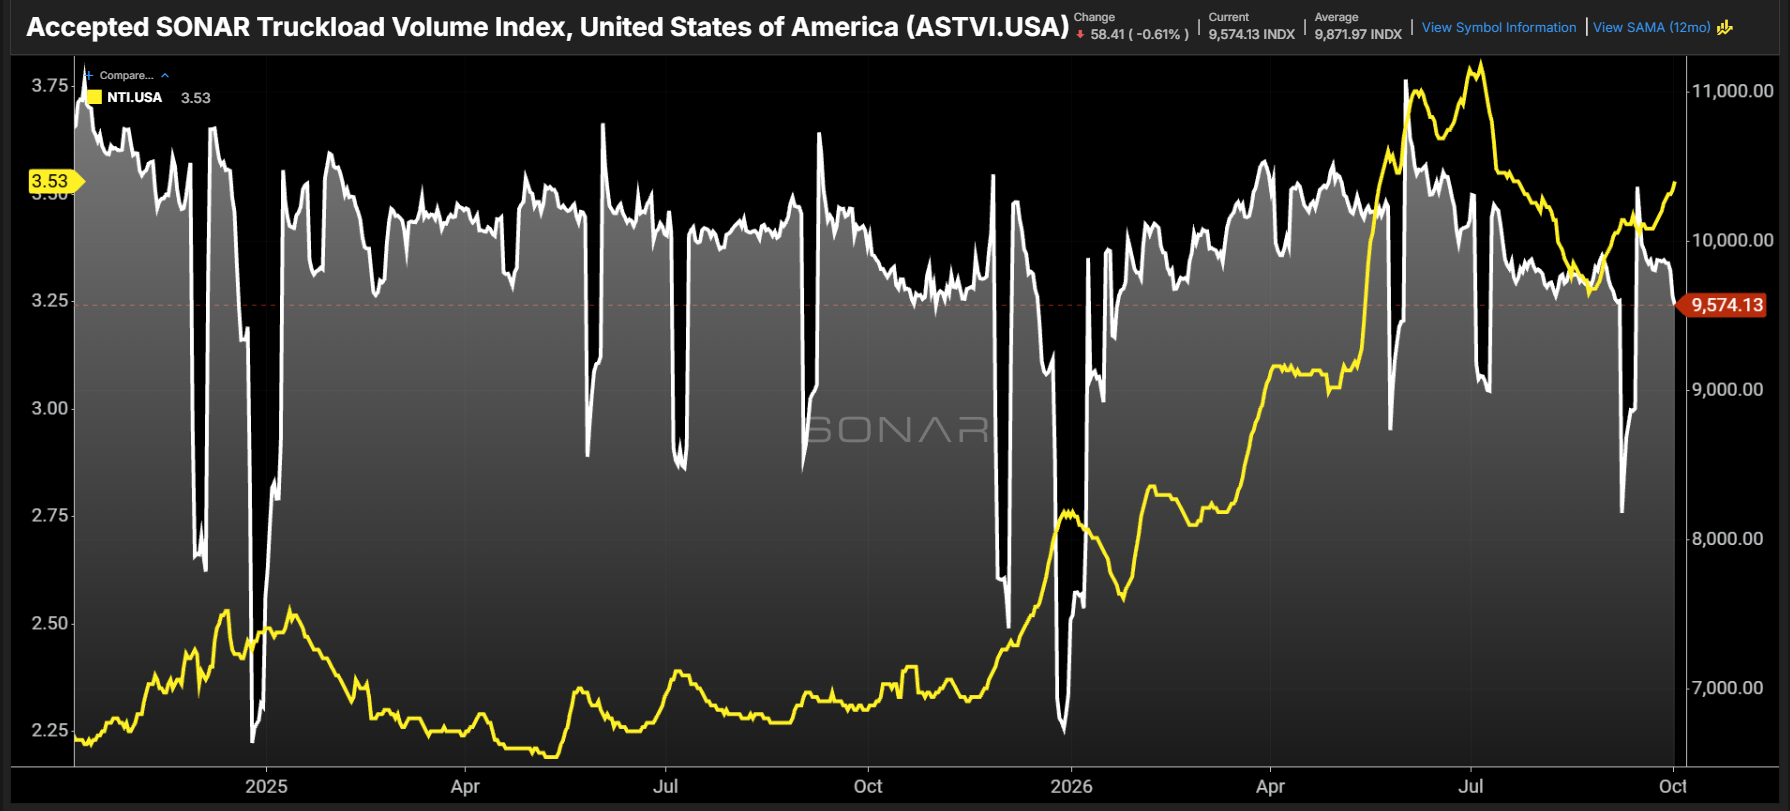
FreightWaves market analyst Zach Strickland highlighted a divergence in the truckload market in his Chart of the Week published October 3. The Accepted SONAR Truckload Volume Index, which measures the volume of contracted loads that carriers accept, fell nearly 3% over the past week to 9,574. That sits below its 12-month average of 9,872.
Over the same stretch, the National Truckload Index, which tracks dry van spot rates including fuel, climbed back to $3.53 per mile. That is more than 10% above its late-August low and roughly 50% higher than at this time last year. The chart plots both series from SONAR data under the tickers ASTVI.USA and NTI.USA.
Tender rejection rates dropped from 14.6% on September 19 to 13.78% on October 1. When accepted tenders and rejections fall together, demand usually eases and spot rates normally decline as well. Strickland noted that tenders are typically placed three to four days ahead of pickup, while spot loads average less than two days of lead time, so a short timing gap is possible. The divergence lasted most of September, which is longer than timing alone usually explains.
Rising diesel costs offer another explanation. Fuel prices climbed sharply through September, and carriers face higher expenses before revenue arrives, since many are paid days or weeks after delivery. Spot rates tend to react to fuel with a lag. The analysis concludes that the market remains tight enough for carriers to pass fuel cost inflation through to shippers even as demand slips.
Source: FreightWaves - https://www.freightwaves.com/news/truckloads-mixed-signals