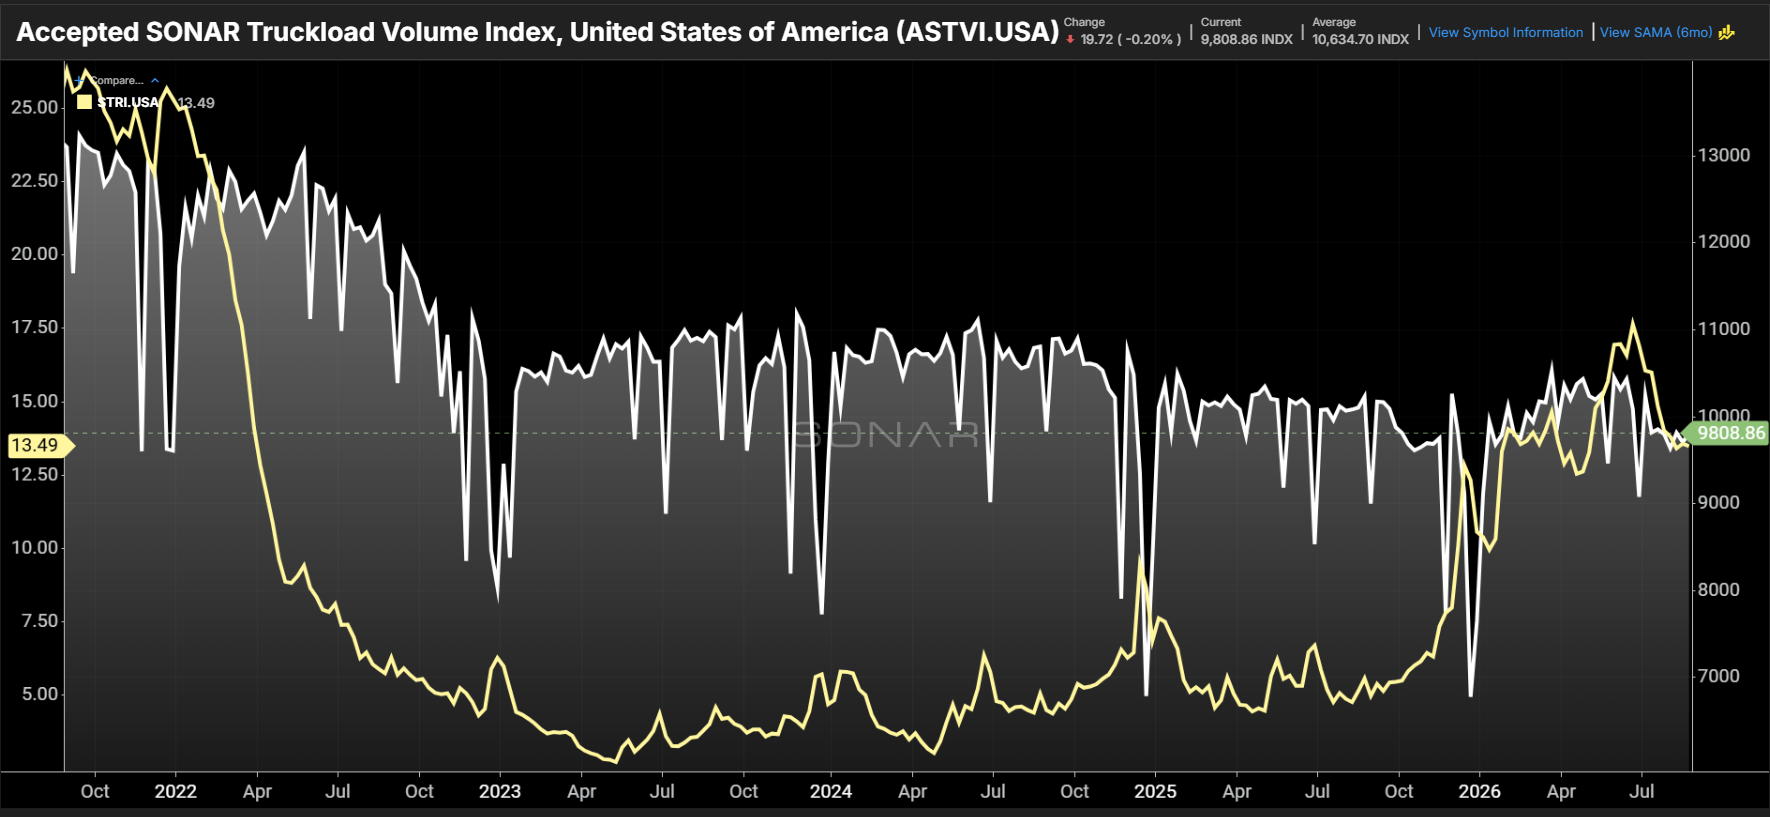
FreightWaves SONAR data show the Accepted Truckload Volume Index (ASTVI), which tracks the truckload tenders carriers accept under existing rate agreements, averaging about 9,800 in a late-August weekly reading. The SONAR Truckload Rejection Index (STRI), the share of tendered loads rejected, hovered near 13.5%. Both indexes sit below their 12-month highs.
The chart plots the two series from late 2021 through summer 2026. The ASTVI reading of 9,808.86 compares with a six-month average of 10,634.70 shown in the chart header, and the STRI reading is 13.49.
FreightWaves analysts describe the current cycle as the most supply-driven in recent history. Accepted tender volumes work as a proxy for total truckload demand when rejection rates stay below 5%. At higher rejection rates, more loads are covered on the spot market or outside existing contracts, and ASTVI undercounts demand.
Flat accepted tenders alongside rising rejections signaled capacity erosion in October of both 2024 and 2025. Both indexes falling together reflected demand weakness in July 2026. Recent ASTVI levels sit close to those of 2019. Rejection rates stayed below 5% for most of 2019 and below 6% last fall, so roughly the same demand now comes with more than twice the tightness.
Analysts noted that Q2 2026 earnings reports from carriers showed no fleet growth, with most reporting annual declines in active units. Class 8 orders rose this year from a weak 2025 base, and ACT and FTR cite fleet replacement as the primary driver.
Source: FreightWaves - https://www.freightwaves.com/news/supply-driven-trucking-market-cycle-explained-in-the-data